Charge Amount vs Charging Time for both of Home Charging and Quick Charge.
(The latest update: December 15th, 2025)
(The first upload: December 20th, 2019)
EV リーフの充電量 (実測値)
- Tested car: Nissan LEAF
Summary
- The temperature dependence of Charging Speed (Charge Amount per Unit Time) is different in Quick Charge and Normal Charge (Home Charging).
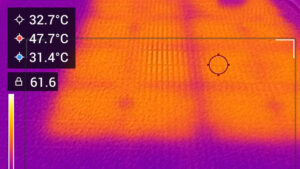
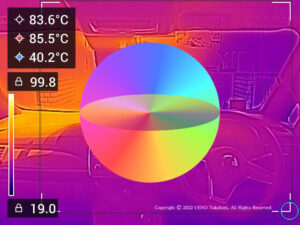
- Quick Charge: The charging speed varies with the environmental temperature as shown here.
- Normal Charge (Home Charging): The charging speed does not depend on the environmental temperature as shown here.
Test Conditions:
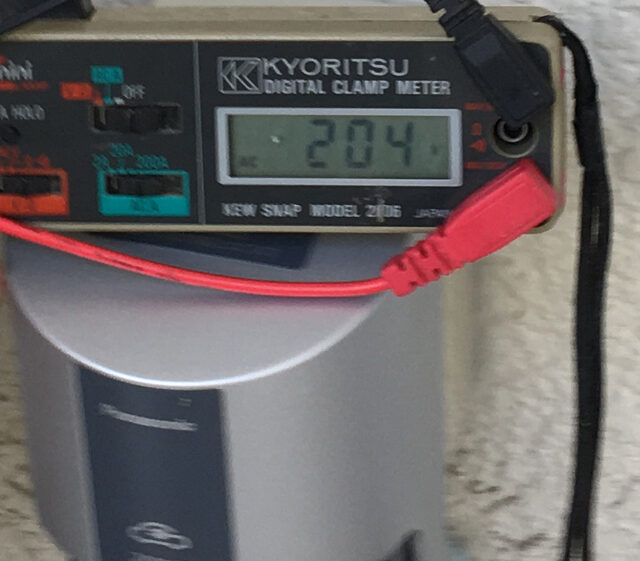
Normal Charger (Home Charging)
The 200V/15A tap for EV use is used at home. The voltage is measured as 204V。
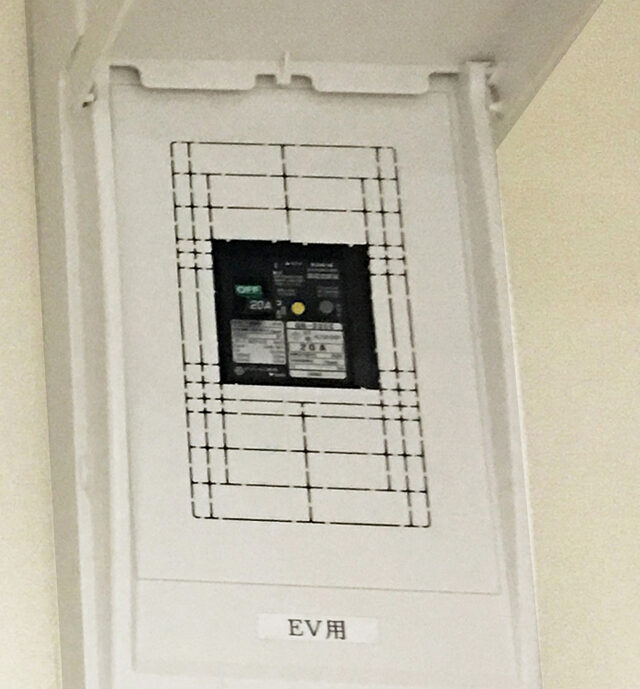
The braker for EV is 200V/20A.
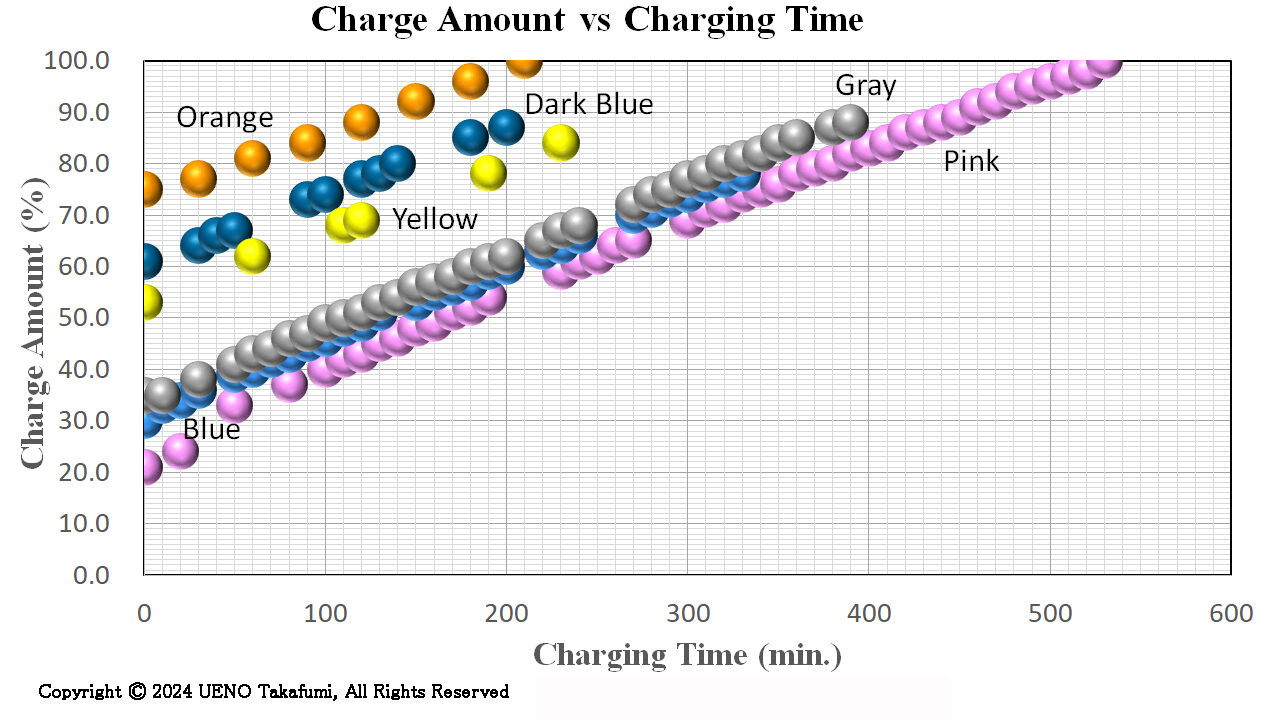
Charge Amount vs Charging time
The following figure shows the relation between the Charge Amount and the Charging Time. There is no temperature dependence.
Conditions:
- Power Source: AC200Volts/15A
- Temperature: 0 to 24 ℃:
- Pink: 20 to 21℃
- Orange: 18 to 24 ℃
- Yellow: 9℃
- Blue: 1 to 6℃
- Gray: 1 to 6℃
- Dark Blue: -0.2 to 3.8℃
The Charge Amount increases linearly with the Charging Time. The gradients of 6 lines are almost the same, meaning that there is no temperature dependence, although in the case of Quick Charge, the Charging Speed becomes lower at low temperature compared with high temperature.
EV Charging Cost is detailed here.
Quick Charger
The battery charge amount in 30 minutes is measured by using EV quick charger. The EV quick charger is 44kWh.
Definitions:
- State of Charge (SOC) is a measure of the level of charge of an electric battery relative to its capacity. It is expressed in percentage.
- Charge Amount is the amount of charge added to the battery in 30 minutes, and it is expressed in percentage.
Charge Amount vs Temperature vs SOC at the Start of Charging
The following 3D figure shows the battery charge amount, the temperature and the SOC at the start of charging. The horizontal axis is temperature, and the vertical axis is the charge amount. The depth axis is the SOC at the start of charging. Each bar is expressed in 3 colors depending on the SOC at the start of charging (blue < 40%, 40%<yellow<50%, 50%<pink).

- Charge Amount decreases as the temperature becomes low, and it increases as the temperature becomes high. For example, when the SOC at the start of charging is 32%, Charge Amount is 50% at 25 ℃, although Charge Amount is 45% at 15℃.
- Charge Amount increases when the SOC at the start of charging is low. For example, at 8℃ Charge Amount is 37%, when the SOC at the start of charging is 41%, however Charge Amount is 30%, when the SOC at the start of charging is 50%.
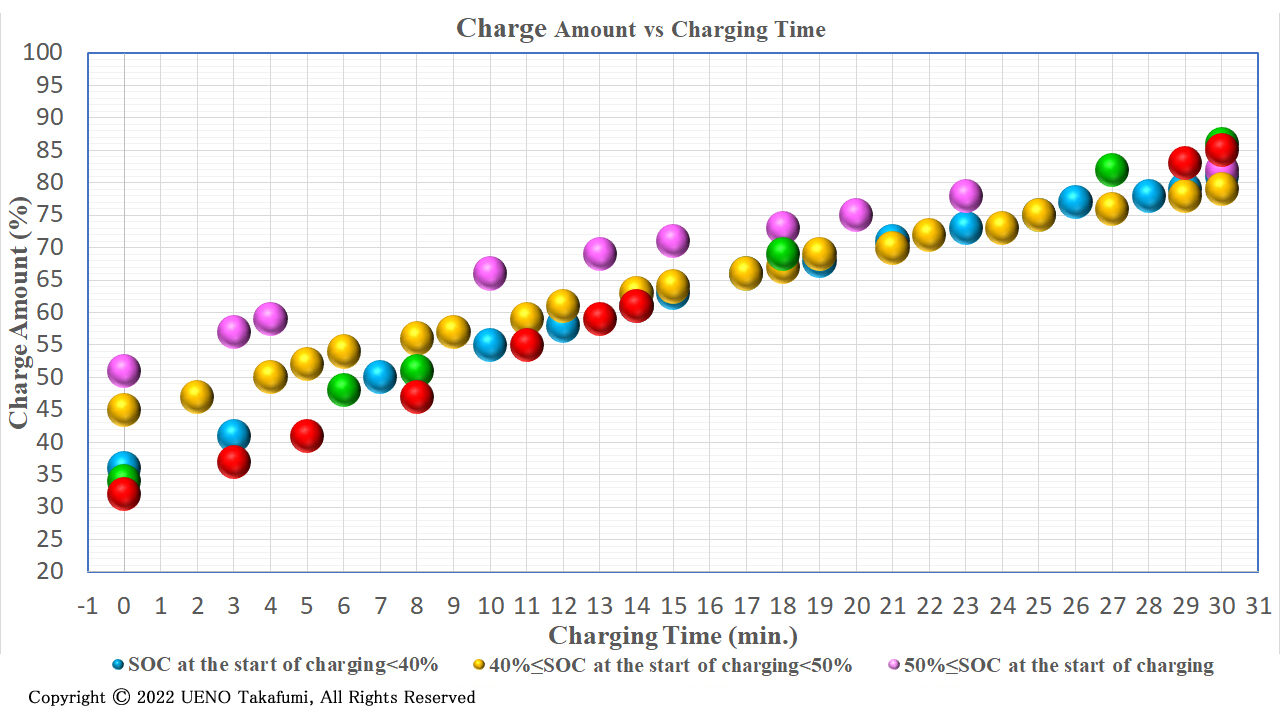
The following figure is 2D expression, where the SOC at the start of charging is expressed in 3 colors depending on the SOC at the start of charging (blue < 40%, 40%<yellow<50%, 50%<pink). As clearly indicated in the graph below,
- If the SOC at the start of charging is higher, Charge Amount is less.
- If the temperature is lower, Charge Amount is larger.

Charge Amount vs Temperature (Monthly Average)

Charge Amount vs the charging time (the elapsed time since the start of charging)
As shown above, Charge Amount varies with the temperature and the SOC at the start of charging. Here, the relation between the SOC and the charging time since the start of charging is shown in the following figure. The gradient of each line indicates the Charging Speed. The Charging Speed becomes lower at lower temperature, as shown below.
- Red: The SOC at the start of charging is 32%. The temperature is 31 ℃. The Battery Charge Amount is 51%.
- Green: The SOC at the start of charging is 34%. The temperature is 31 ℃. The Battery Charge Amount is 52%.
- Blue: The SOC at the start of charging is 36%. The temperature is 20 ℃. The Battery Charge Amount is 45%.
- Yellow: The SOC at the start of charging is 45%. The temperature is 7 ℃. The Battery Charge Amount is 34%.
- Pink: The SOC at the start of charging is 51%. The temperature is 8 ℃. The Battery Charge Amount is 31%.
As shown above, Charge Amount is larger, as the temperature is higher and the SOC at the star of charging is lower.